[Please note that the following article — while it has been updated from our newsletter archives — may not reflect the latest software interface and plot graphics, but the original methodology and analysis steps remain applicable.]
Guest Submission - Larry H. Crow, Ph.D., Crow Reliability Resources
Software Used: RGA
Most complex systems, such as automobiles, communication systems, aircraft, aircraft engine controllers, printers, medical diagnostics systems, helicopters, train locomotives, etc., are repaired and are not replaced when they fail. When these systems are fielded or subjected to a customer use environment, it is often of considerable interest to determine the reliability and other performance characteristics under these conditions. Areas of interest may include assessing the expected number of failures during the warranty period, maintaining a minimum mission reliability, addressing the rate of wearout, determining when to replace or overhaul a system and minimizing life cycle costs. In general, a distribution, such as the Weibull distribution, cannot be used to address these issues. In order to address the reliability characteristics of complex repairable systems, a process is often used instead of a distribution. The most popular process model is the Power Law model. This model is popular for several reasons. One is that it has a very practical foundation in terms of minimal repair. This is the situation when the repair of a failed system is just enough to get the system operational again. Second, if the time to first failure follows the Weibull distribution, then each succeeding failure is governed by the Power Law model in the case of minimal repair. From this point of view, the Power Law model is an extension of the Weibull distribution. In other words, the Weibull distribution addresses the very first failure and the Power Law model addresses each succeeding failure for a repairable system. Another reason for the popularity of the Power Law model is that it generalizes the Poisson process based on the exponential distribution. Also, from a management point of view, the Power Law model is generally easy to use and understand, which lends itself to providing useful, practical results for many real world applications.
The Power Law model for application to data for multiple systems was first introduced by Crow (1974). Estimation and other statistical procedures for this model are given in Crow (1974), (1990), (1993), (2003). See also Ascher and Feingold (1984) and the IEC International Standard 61710 "Power law model - Goodness-of-fit tests and estimation methods" for additional information on the Power Law model. This article will give some practical background on the model, discuss data collection and give an application for reducing the life cycle costs for a fleet.
Background on the Power Law Model
To fix ideas, visualize a socket into which a component is inserted at time 0. When the component fails, it is replaced immediately with a new one of the same kind. After each failure, the socket is put back into an "as good as new condition." Each component has a time to failure that is determined by the underlying distribution. It is important to note that a distribution relates to a single failure. The sequence of failures for the socket constitutes a random process called a "renewal process."
In the illustration below, the component life is Xj and tj is the system time to the j-th failure.
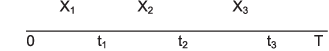
Each component life Xj in the socket is governed by the same distribution F(x).
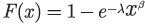
A distribution, such as the Weibull, governs a single lifetime. There is only one event associated with a distribution. The distribution F(x) is the probability that the life of the component in the socket is less than x. In the illustration above, X1 is the life of the first component in the socket. F(x) is the probability that the first component in the socket fails in time x. When the first component fails, it is replaced in the socket with a like component. The probability that the life of the second component is less than x is given by the same distribution function, F(x). For the Weibull distribution:
A distribution is also characterized by its density function:
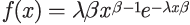
The density function for the Weibull distribution is:
In addition, an important reliability property of a distribution function is the failure rate given by:
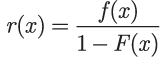
The interpretation of the failure rate is that for a small interval of time Δx, r(x)Δx is approximately the probability that a component in the socket will fail between time x and time x + Δx, given that the component has not failed by time x.
For the Weibull distribution, the failure rate is given by:
It is important to note the condition that the component has not failed by time x. Again, a distribution deals with one lifetime of a component and does not allow for more than one failure. The socket has many failures and each failure time is individually governed by the same distribution.
If the failure rate is increasing, then this is indicative of component wearout. If the failure rate is decreasing, then this is indicative of infant mortality. If the failure rate is constant, then the component failures follow an exponential distribution. For the Weibull distribution, the failure rate is increasing for β > 1, decreasing for β < 1 and constant for β = 1.
Each time a component in the socket is replaced, the failure rate of the new component converts back to the value at time 0. This means that the socket is as good as new after each failure and the subsequent replacement by a new component. This process is continued for the operation of the socket.
Suppose that a system consists of many components, with each component in a socket. A failure in any socket constitutes a failure of the system. Each component socket is a renewal process governed by its respective distribution function. When the system fails due to a failure in a socket, the component is replaced and the socket is again as good as new. The system has been repaired. Because there are many other components still operating with various ages, the system is not typically put back into a “like new” condition after the replacement of a single component. For example, a car is not as good as new after the replacement of a failed water pump. Therefore, distribution theory does not apply to the failures of a complex system, such as a car. That is, in general, the intervals between failures for a complex repairable system do not follow the same distribution. Distributions apply to the components that are replaced in the sockets but not at the system level.
At the system level, a distribution applies to the very first failure. There is one failure associated with a distribution. For example, the very first system failure may follow a Weibull distribution.
For many systems in a real world environment, a repair is only enough to get the system operational again. If the water pump fails on the car, the repair consists only of installing a new water pump. If a seal leaks, the seal is replaced but no additional maintenance is done, etc. This is the concept of minimal repair. For a system with many failure modes, the repair of a single failure mode does not greatly improve the system reliability from what it was just before the failure. Under minimal repair, we assume we have a complex system with many failure modes and the system reliability after a repair is the same as it was just before the failure. In this case, the sequence of failure at the system level follows a non-homogenous Poisson process (NHPP).
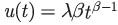
The system age when the system is first put into service is time 0. Under the NHPP, the first failure is governed by a distribution F(x) with failure rate r(x). Each succeeding failure is governed by the intensity function u(t) of the process. Let t be the age of the system and Δt is very small. The probability that a system of age t fails between t and t + Δt is given by the intensity function u(t)Δt. Notice that this probability is not conditioned on no system failure up to time t, as is the case for a failure rate. The failure intensity u(t) for the NHPP has the same functional form as the failure rate governing the first system failure. That is, u(t) = r(t), where r(t) is the failure rate for the distribution function of the first system failure.
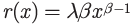
If the first system failure follows the Weibull distribution, the failure rate is:
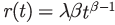
Under minimal repair, the system intensity function is:
This is the Power Law model. It can be viewed as an extension of the Weibull distribution. The Weibull distribution governs the first system failure and the Power Law model governs each succeeding system failure.
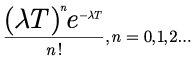
If the system has a constant failure intensity u(t) = λ, then the intervals between system failures follow an exponential distribution with failure rate λ. If the system operates for time T, then the random number of failures N(T) over 0 to T is given by the Poisson distribution with mean λT. That is, probability N(T) = n is given by the Poisson probability:
This is referred to as a homogeneous Poisson process because there is no change in the intensity function. This is a special case of the Power Law model for β = 1. That is, the Power Law model is a generalization of the homogeneous Poisson process and allows for change in the intensity function as the repairable system ages. For the Power Law model, the failure intensity is increasing for β > 1 (wearout), decreasing for β < 1 (infant morality) and constant for β = 1 (useful life).
Data
The Power Law model is often used to analyze the reliability for complex repairable systems in the field. A system of interest may be the total system, such as a helicopter, or it may be subsystems, such as the helicopter transmissions or rotator blades, which are also complex repairable systems. When these systems are new and first put into operation, the start time is 0. As these systems are operated, they accumulate age, e.g., miles on automobiles, number of pages on copiers, hours on helicopters. When these systems fail, they are repaired and put back into service.
Some system types may be overhauled and some may not, depending on the maintenance policy. For example, the automobiles of interest may not be overhauled but helicopter transmissions may be overhauled after a period of time. In practice, an overhaul may not convert the system reliability back to where it was when the system was new. However, an overhaul will generally make the system more reliable. Appropriate data for the Power Law model is over cycles. If a system is not overhauled, then there is only one cycle and the zero time is when the system is first put into operation. If a system is overhauled, then the same serial number system may generate many cycles. Each cycle will start a new zero time, the beginning of the cycle. The age of the system is from the beginning of the cycle. For systems that are not overhauled, there is only one cycle and we are interested in the reliability characteristics of a system as the system ages during its life. For systems that are overhauled, we are interested in the reliability characteristics of the system as it ages during its cycle.
For the Power Law model, a data set for a system will consist of a starting time S, an ending time T and the accumulated ages of the system during the cycle when it had failures. For this discussion, we will assume we have data from the beginning of a cycle (i.e., the starting time is 0), although we can have non-zero starting times with the Power Law model. For example, suppose we have data for a system for 2000 hours during a cycle. The starting time is S = 0 and the ending time is T = 2000. Over this period, failures occurred at system ages (during the cycle) of 50.6, 840.7, 1060.5, 1186.5, 1613.6 and 1843.4. In this example, there were no failures between 1843.4 and 2000 hours. These are the accumulated operating times within the cycle, for example, the odometer mileages on a truck when it failed or the time elapse meter on a device reset to zero at the beginning of a cycle.
We may be interested in how the systems of interest perform as part of a fleet. For a fleet, we need to verify that the systems have the same configuration, same maintenance policy and same operational environment. In this case, we will need a random sample from the fleet. Each item in the sample will have a cycle starting time S = 0, an ending time T for the data period and the accumulated operating times during this period when the system failed, as illustrated in the previous data set.
There are many ways to generate a random sample of K systems. One way is to generate K random serial numbers from the fleet. We then go to the records corresponding to the randomly selected systems. If the systems are not overhauled, then we will need the record from when each system was first put into service, for example, from odometer mileage = zero. Each system may have a different amount of total usage, so the ending times, T, may be different. If the systems are overhauled, then we will need the records for the last completed cycle. The starting and ending times and the accumulated times to failure for the K systems constitute the random sample from the fleet.
There is also a useful and efficient method for generating a random sample for systems that are overhauled. If the overhauled systems have been in service for a considerable period of time, then each serial number system in the fleet would go through many overhaul cycles. In this case, the systems coming in for overhaul actually represent a random sample from the fleet. As K systems come in for overhaul, the data for the current completed cycles would be a random sample of size K.
We may be interested primarily in the warranty period. In this case, we may randomly choose K serial numbers for systems that have been in customer use for a period longer than the warranty period. We then check the warranty records. For each of the K systems that had warranty work, the ages corresponding to this service are the failure times. If a system did not have warranty work, then the number of failures recorded for that system is zero. The starting times are all zero and the ending time for each of the K systems is the warranty operating usage time, e.g., hours, copies, miles.
Estimation
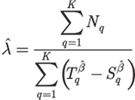
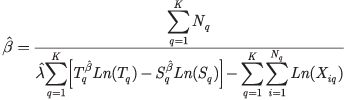
We are interested in estimating the parameters λ and β for the Power Law failure intensity function based on a random sample from the fleet. In the general situation, we have K systems in our random sample and the starting times are Sq, the ending times are Tq and Xiq is the i-th successive failure time for the q-th system. There are a total of Nq failures for the q-th system. The general maximum likelihood estimates for λ and β are the values that satisfy Eqns. 1 and 2 below, where Ln is log to the base e.
| |
 |
(1) |
| |
|
|
| |
 |
(2) |
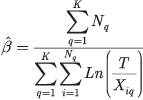
If the starting times are all zero and the ending times are all equal to T, then these equations simplify to Eqns. 3 and 4 below.
| |
 |
(3) |
| |
|
|
| |
 |
(4) |
We illustrate typical data with a sample of size K = 3. Of course, in practice, the more systems in our sample the better the estimates are. Each system in this sample has a starting time of Sq = 0, and cycle time of Tq = 2000, q = 1, 2, 3. The Xs are the ages when the systems failed.
| xi1 |
xi2 |
xi3 |
| 50.6 |
568.7 |
1016.7 |
| 840.7 |
989.5 |
1108.3 |
| 1060.5 |
1002.0 |
1203.5 |
| 1186.5 |
1018.5 |
1246.3 |
| 1613.6 |
1183.9 |
1902.4 |
| 1843.4 |
1550.9 |
|
| |
1926.9 |
|
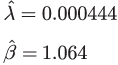
The estimates for our data set are:

The estimate of beta (> 1) indicates an increasing failure intensity function with possible wearout. This can be checked in practice with confidence intervals on beta.
Application to Minimum Life Cycle Cost
We illustrate an application of the Power Law model for reducing the cost to maintain a fleet of systems. One consideration in reducing the cost to maintain a fleet of systems when β > 1 is to establish an overhaul policy that will minimize the total life cost of the system. Let the average repair cost be C1 and overhaul cost be C2. If the system is overhauled at time T, then the life cycle cost per unit time of operation is given by:
| |
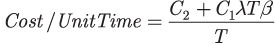 |
(5)
|
What is the overhaul time that will minimize the total life cycle cost? The solution for the Power Law model with parameters λ, β and average repair cost C1 and overhaul cost C2 is the optimum overhaul time T0 (Ref. 1) given by:
| |
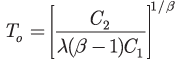
|
(6)
|
This is the point at which it is cheaper to overhaul the system and return it to the fleet than to continue repairs. The value T0 is called the “economical life” of the unit and is the operating time when the average cost of operation per unit time is the minimum. The estimate for the optimum overhaul time to minimize life cycle cost is given by:
| |
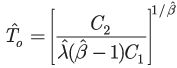
|
(7)
|
Example for Minimum Life Cycle Cost Model
We next give an example of the life cycle cost model for the Power Law model. Suppose we consider eleven systems selected at random from a fleet. (A small number of systems are used for the example in order to illustrate the methods. In practical applications, a much larger data set would be analyzed. This is hypothetical data and does not represent any actual system.) The nominal overhaul cycle is 1500 but the actual overhaul time will often vary. The history of these systems for the last complete overhaul cycle is given in the following table. The starting times are all zero.
| System |
Failure Times |
Overhaul Time |
| 1 |
68, 1137, 1167 |
1268 |
| 2 |
682, 744, 831 |
1300 |
| 3 |
845 |
1593 |
| 4 |
263, 399 |
1421 |
| 5 |
|
1574 |
| 6 |
|
1415 |
| 7 |
598 |
1290 |
| 8 |
|
1556 |
| 9 |
|
1426 |
| 10 |
730 |
1124 |
| 11 |
|
1568 |
The ML estimates of λ and β are:
Because this is a small sample size, we use an upper confidence interval (CL) on β given in Ref. 5. A 95% upper CL on β is β* = 1.774 and using this in Eqn. 1, we estimate λ by λ* = 0.000002558. For an average repair cost of C1 = $29,860 and an overhaul cost of C2 = $100,000, the optimum overhaul time to minimize the life cycle cost is estimated from Eqn. 7 as 3237 hours. This is the economic life overhaul time that will minimize the total life cycle costs due to repairs and overhead.
For an overhaul time of 1500 hours, the corresponding average cost per hour, using Eqn. 5, is $88.60. This average cost per hour reduces to $70.68 for the optimum overhaul time of 3237 hours. This is the minimum cost per hour of fleet operation. For example, if we overhaul at 4000 hours, the cost increases to $71.88. With the overhaul time increased from 1500 hours to the optimum of 3237 hours, there is a cost savings of $18.00 per hour of fleet operation time.
Conclusions
In this article, we have stressed the importance of not using a distribution, such as the Weibull, to analyze the reliability of repairable systems and have presented a widely used alternative, the Power Law model. For this model, we have given background to understand the concepts, estimation methods and provided approaches to data collection. The model and concepts were illustrated by an example for minimizing fleet life cycle costs.
References
1. Barlow, R.E. & Proschan, F. (1967). Mathematical Theory of Reliability. John Wiley & Sons, Inc.
2. Crow, L.H. (1974). Reliability Analysis for Complex, Repairable Systems, in Reliability and Biometry, ed. by F. Proschan & R.J. Serfing, (pp. 379-410). Philadelphia: SIAM.
3. Ascher, H. & Feingold, H. (1984). Repairable Systems Reliability. New York, NY: Marcel Dekker, Inc.
4. Crow, L.H. (1990). Evaluating the Reliability of Repairable Systems. Proceedings of the 1990 Annual Reliability and Maintainability Symposium, 275-279.
5. Crow, L.H. (1993) Confidence Intervals on the Reliability of Repairable Systems. Proceedings of the 1993 Reliability and Maintainability Symposium, 126-134.
6. IEC 61710, Power law model - Goodness-of-fit tests and estimation methods. New York, New York: ANSI.
7. Crow, L.H. (2003). Methods for Reducing the Cost to Maintain a Fleet of Repairable Systems. Proceedings of the 2003 Annual Reliability and Maintainability Symposium, 392-399.
About the Author
|
Dr. Larry H. Crow is an independent consultant as well as an instructor and consultant for ReliaSoft in the areas of reliability growth and repairable systems analysis. He developed the Crow (AMSAA) model and other reliability models, which have been incorporated into U.S. DoD military handbooks as well as national and international standards and service regulations on reliability.
Developed with Dr. Crow’s cooperation, ReliaSoft’s RGA software applies his "tried and true" methods for reliability growth, repairable systems and related analyses along with some recently developed methodologies and refinements.
On the Web: http://www.reliasoft.com/products/reliability-analysis/rga
|
